
Dashboards
Exchange 2010/2013 Message Tracking Logs
Description:
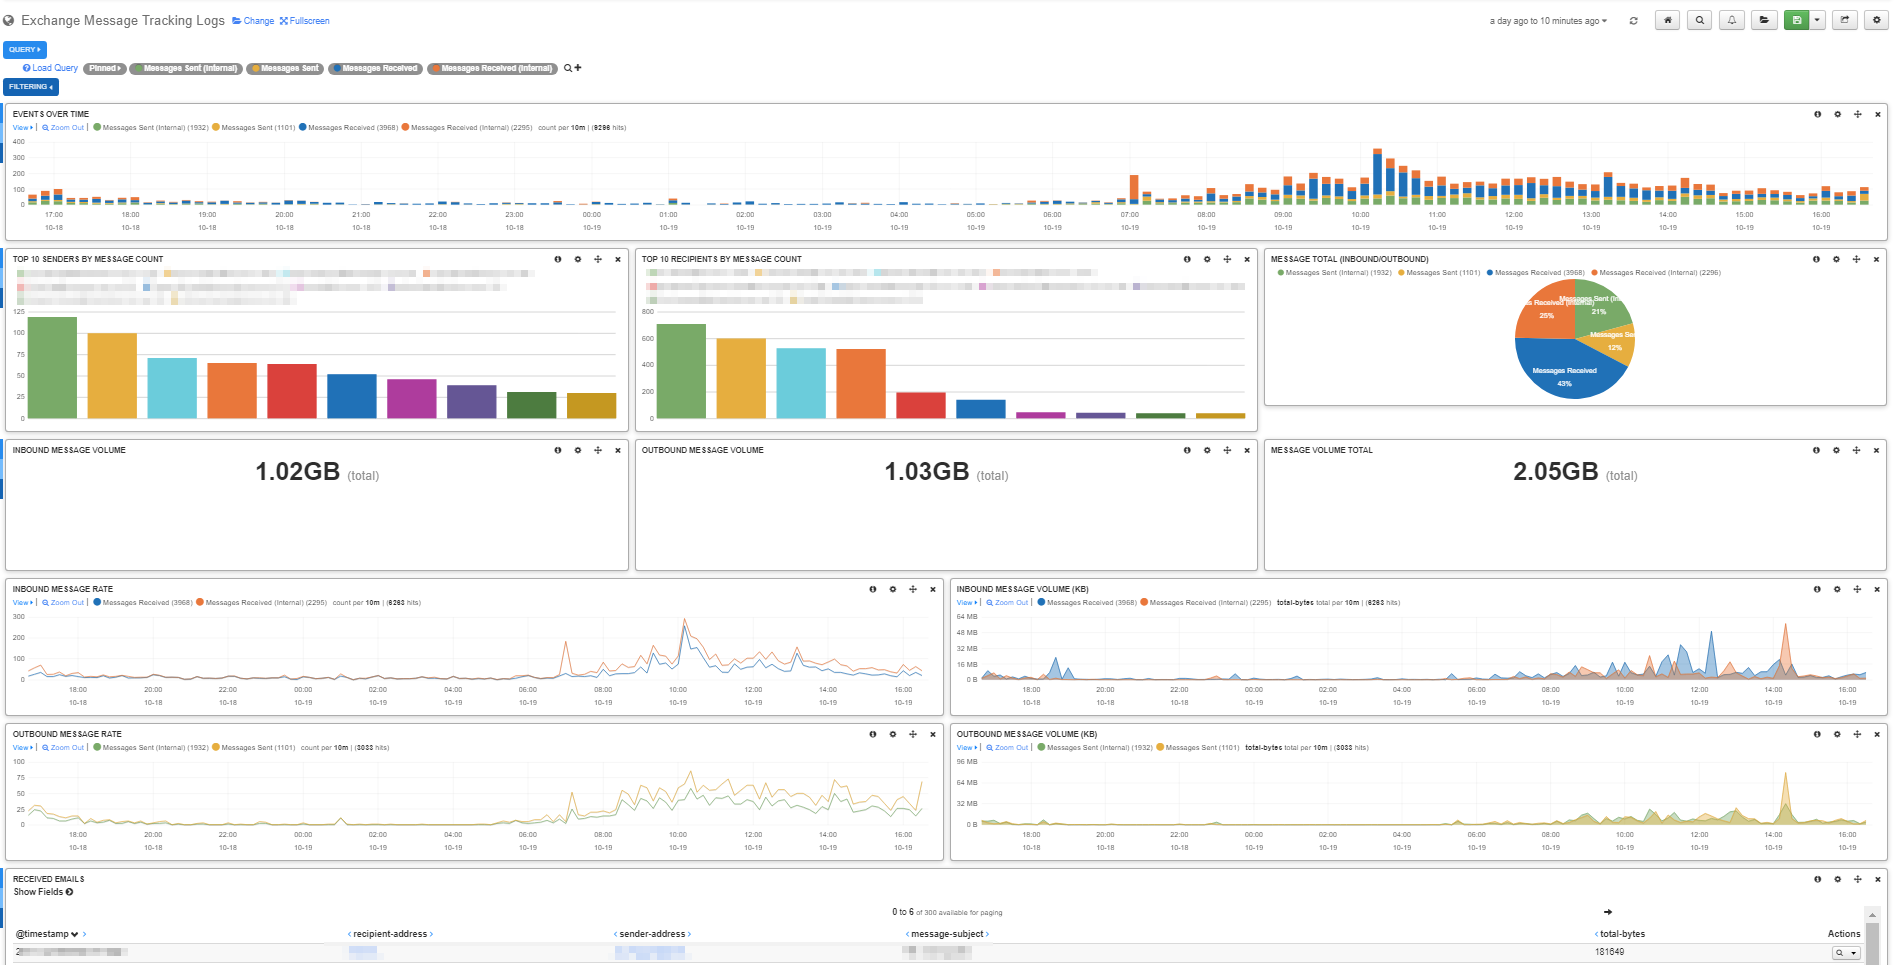
This dashboard monitors the Message Tracking Logs in Exchange 2010 onwards.
I can’t take credit for developing this, I just adapted it for NLS – Original creator here: https://elijahpaul.co.uk/analysing-exchange-2013-message-tracking-logs-using-elk-elasticsearch-logstash-kibana/
Current Version
Last Release Date
October 19, 2017
Compatible With
- Nagios Log Server
Owner
License
GPL

Meet The New Nagios Core Services Platform
Built on over 25 years of monitoring experience, the Nagios Core Services Platform provides insightful monitoring dashboards, time-saving monitoring wizards, and unmatched ease of use. Use it for free indefinitely.
Monitoring Made Magically Better
- Nagios Core on Overdrive
- Powerful Monitoring Dashboards
- Time-Saving Configuration Wizards
- Open Source Powered Monitoring On Steroids
- And So Much More!
Project Files
| File | Description |
|---|---|
| Exchange Message Tracking Logs-1508391614806 |
Project Photos
Project Notes
This dashboard monitors the Message Tracking Logs in Exchange 2010 onwards.
I can't take credit for developing this, I just adapted it for NLS.
Original creator as follows:
https://elijahpaul.co.uk/analysing-exchange-2013-message-tracking-logs-using-elk-elasticsearch-logstash-kibana/
_________________________________________
Setup an Input Filter on NLS with the following;
tcp {
type => 'exchange'
port => 5141
}
______________________________________________________
Install NXLog on Exchange CAS and add the following to conf file;
define BASEDIR C:Program FilesMicrosoftExchange ServerV14TransportRolesLogsMessageTracking
Module im_file
File '%BASEDIR%MSGTRK????????*-*.LOG'
SavePos TRUE
Exec if $raw_event =~ /HealthMailbox/ drop();
Exec if $raw_event =~ /^#/ drop();
Exec $type = 'Exchange';
Path in_exchange => out_exchange
________________________________________________
Setup a filter on NLS with the following;
if [type] == 'exchange' {
csv {
add_tag => [ 'exh_msg_trk' ]
columns => [ 'date-time', 'client-ip', 'client-hostname', 'server-ip', 'server-hostname', 'source-context', 'connector-id', 'source', 'event-id', 'internal-message-id', 'message-id', 'recipient-address', 'recipient-status', 'total-bytes', 'recipient-count', 'related-recipient-address', 'reference', 'message-subject', 'sender-address', 'return-path', 'message-info', 'directionality', 'tenant-id', 'original-client-ip', 'original-server-ip', 'custom-data' ]
separator => ','
remove_field => [ 'date-time' ]
}
grok {
match => [ 'message', '%{TIMESTAMP_ISO8601:timestamp}' ]
}
mutate {
convert => [ 'total-bytes', 'integer' ]
convert => [ 'recipient-count', 'integer' ]
split => [ 'recipient-address', ';']
split => [ 'source-context', ';' ]
split => [ 'custom-data', ';' ]
}
if '_csvparsefailure' in [tags] {
drop { }
}
if '_grokparsefailure' in [tags] {
drop { }
}
}
_____________________________________________________
NOTES:
You will need to modify the "host" section in the nxlog file.
You will need to modify the query strings in the JSON file attached to match your "server/client hostnames" and also your "connector-id" to make your Exchange config.
You will need to make sure Message Tracking Logging is turned on in Exchange, just google if unsure on how to do.
You will need to open up the ports on the firewall on the NLS to connect into port 5141.
You can use UDP if you prefer.
Reviews
(0)
Add a Review
Page Sections
Project Stats
Rating
0 (0)
Favorites
0
Views
8,430